(Tips) 地図上に点をプロット
作成者:山崎哲
概要
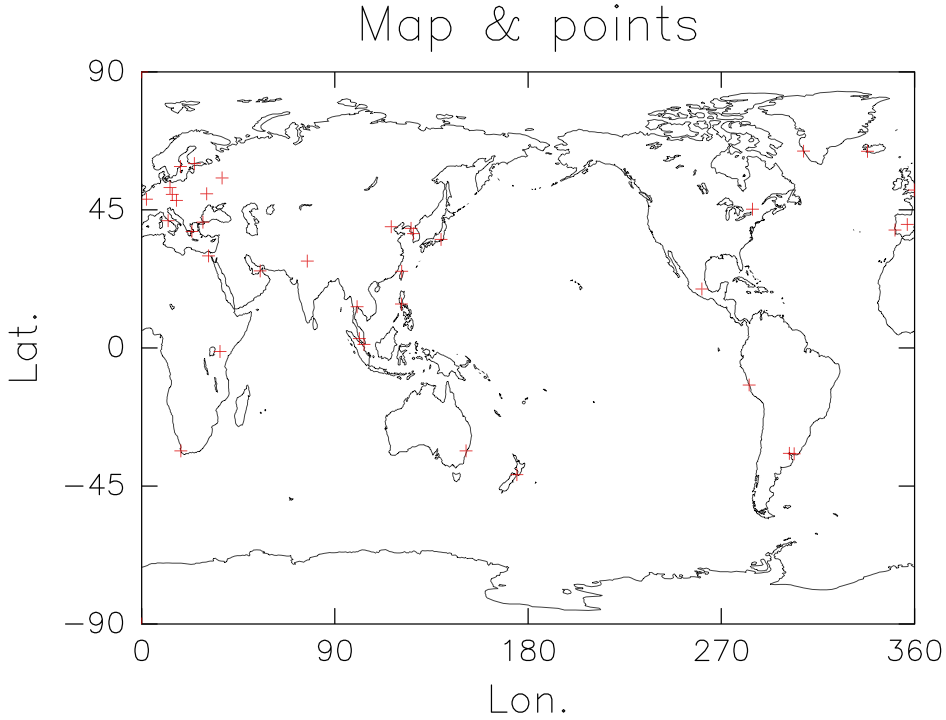
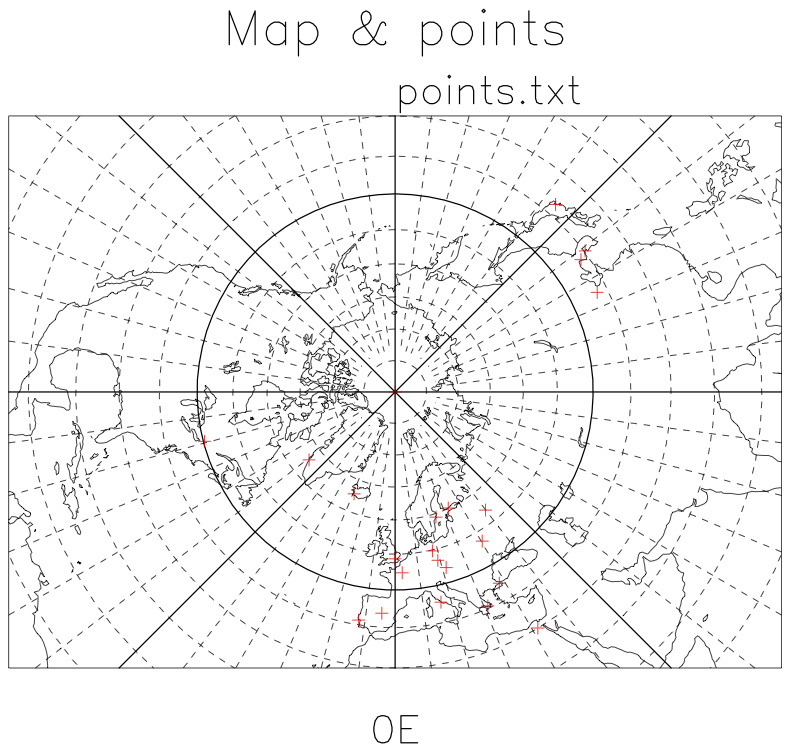
地図上に点をプロットするスクリプト。メルカトル図法用とポーラーステレオ用の2つを紹介する。
使い方
プロットしたい経度・緯度情報の入ったテキストファイルを用意する。中身は、
%less points.txt
 116.26 39.55
 77.11 28.33
 139.46 35.40
 126.58 37.32
というフォーマットで、経度、緯度の順に1スペース開けて並べる。このフォーマットは、fortranで
do i = 1, imax
write(1,*) lon(i), lat(i)
enddo
と出力したformattedファイルと同じ。imaxはプロットする点の数を示す。
テキストファイルへのパスを記述して、rubyスクリプト(以下サンプル)を実行する。
サンプル
メルカトル図法版
require "numru/ggraph"
require "numru/dcl"
include NumRu

## setting

# file
file1 = File.open("points.txt",'r') #読み込むテキストファイル名

# IO switch
io = 2 #1 standard, 2 ps, 4+[d] png

# draw range
x1 = 0
x2 = 360
y1 = -90  # y2>y1
y2 = 90

# label interval
lx = (x2-x1)/4
ly = (x2-x1)/8

# mark
marksize=0.01
marktype=2
markindex=20

# general
DCL.gropn(io)
DCL::grfrm

# mapping
DCL::grswnd(x1, x2, y1, y2) #描画範囲を指定
DCL::grsvpt(0.2, 0.9, 0.2, 0.7) #フレームの大きさを指定
DCL::grstrn(1)
DCL::grstrf

#x-label
DCL::uxaxdv('B', lx, lx)
DCL::uxaxdv('T', lx, lx)
DCL::uxsttl('B', 'Lon.', 0.0)

# y-label
DCL::uyaxdv('L', ly, ly)
DCL::uyaxdv('R', ly, ly)
DCL::uysttl('L', 'Lat.', 0.0)
DCL::uddclv(0.0)

# draw map & title
DCL::sglset('lclip','true')
DCL::umpmap('coast_world')
DCL::uxmttl('T', 'Map & points', 0.0)

# draw mark
DCL::uusmks(marksize)
DCL::uusmkt(marktype)
DCL::uusmki(markindex)
loop do
p0 = file1.gets
if p0.nil? then # stop if file reaches EOF
break
end

up = p0.split(/\s+/)
upx = up[1].to_f
upy = up[2].to_f
 print upx, ', ', upy, ' '
xmark = NArray.sfloat(1)
ymark = NArray.sfloat(1)
xmark[0] = upx
if upx < 0 then
xmark[0] = upx + 360
end
ymark[0] = upy
DCL.uumrk(xmark,ymark)
end

DCL.grcls
ポーラーステレオ版
require "numru/ggraph"
require "numru/dcl"
include NumRu
include GGraph

## setting
fname='points.txt' # テキストファイルの名前
fname_title = fname.split(/_/)[0]
title='Map & points' #title
# IO switch
io = 1 #1 standard, 2 ps, 4+[d] png
# draw range
x1 = -180
x2 = 180
y1 = 30 #y2>y1
y2 = 90

# viewport
view_r = (y1-y2).abs
view_center_lon = (x1+x2)/2
view_center_lat = y2
if y1.abs > y2.abs then
view_center_lat = y1
end
# label
label_B = view_center_lon.to_s
if(y1 < 0) then
label_B = (view_center_lon+180).to_s
end
#latlon line inverval
dmj = (x2-x1)/8.0  # Major lineの指定。経度方向に8分割。
dmn = dmj/6.0 # Minor lineの指定。Major lineを6分割。
# mark
marksize=0.01
marktype=2
markindex=20

# file
file1 = File.open(fname,'r')

# general
DCL.gropn(io)
DCL::grfrm
# mapping
DCL::grsvpt(0.2, 0.9, 0.2, 0.7)
DCL::grstrn(31)
DCL::grswnd(x1, x2, y1, y2)
DCL::umscwd(view_center_lon, view_center_lat, view_r) # (lon, lat, r)円形のウィンドウを設定
DCL::umpfit
DCL::grstrf
DCL::slpvpr(1)
# draw map & title
DCL::sglset('lclip','true')
DCL::umpmap('coast_world')
DCL::umpset('dgridmj',dmj)
DCL::umpset('dgridmn',dmn)
DCL::umpset('dgrplmn',10.0)       # Minor lineを極から何度離れた緯度から描くか。
DCL::umpglb                       # 緯経線と地球の輪郭を描く

# draw mark
DCL::uusmks(marksize)
DCL::uusmkt(marktype)
DCL::uusmki(markindex)
loop do
p0 = file1.gets
if p0.nil? then # stop if file reaches EOF
break
end
up = p0.split(/\s+/)
upx = up[1].to_f
upy = up[2].to_f
 print upx, ', ', upy, ' '
xmark = NArray.sfloat(1)
ymark = NArray.sfloat(1)
xmark[0] = upx
if upx < 0 then
xmark[0] = upx + 360
end
ymark[0] = upy
if upy>=y1 && upy<=y2 then
DCL.uumrk(xmark,ymark)
end
end
#title
if y1 > 0 then
 11.times do
 DCL::uxsttl('B', ' ', 0)  #タイトルを描く位置を調整。
 end
else
 5.times do
 DCL::uxsttl('B', ' ', 0)
 end
end
DCL::uxsttl('B', label_B+'E', 0)
if y1 > 0 then
 4.times do
 DCL::uxmttl('T', ' ', 0)
 end
else
 8.times do
 DCL::uxmttl('T', ' ', 0)
 end
end
DCL::uxsttl('T', fname_title, -1)
DCL::uxmttl('T', title, 0)

DCL.grcls
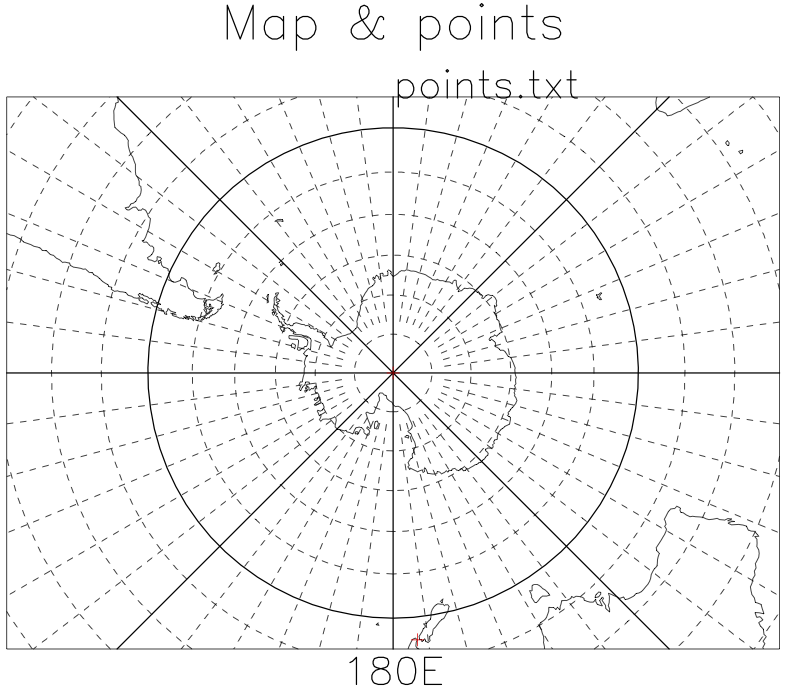
南半球については,
y1 = -90
y2 = -40
などとする:
メモ
- テキストファイルは実数でも整数でもOK。ゼロが先頭にくる(-001.23)場合もOK。
- 経度は東経だけで書いても(220.)、西経をマイナスで記述しても(-140.)OK。
キーワード:[プロット] [サンプル]
参照: