(Application) テキストデータ描画スクリプト dclplot
作成者:辻野智紀
概要
gnuplot のように, テキストカラムデータを上から読み込んで, 折れ線グラフとして描画する ruby スクリプトである. イメージとしては, gpview のテキストデータ版.
(Fortran 90 で作成していた自作ライブラリを ruby に転用したものです.)
ソースファイル
- メインプログラム : dclplot.
- 2017/02/06, 22:00 JST; マーカー描画のバグ修正
- 2015/09/30, 15:00 JST; 機能追加; 高橋さん @ 神戸大 報告
- サンプルデータファイル : Jordan.dat (Jordan, 1958).
依存ライブラリ
- NArray
- Ruby-DCL
環境依存による注意点
csh あるいは tcsh で本スクリプトを実行すると, 四角括弧をもつオプションが指定された際, 以下のエラーが表示される.
$ dclplot --with-xline=[1] --with-yline=[3]
dclplot : No match.
この場合, 四角括弧全体をダブルクォーテーションで囲むと回避されるようです (高橋さん @ 神戸大 報告).
$ dclplot --with-xline="[1]" --with-yline="[3]"
使い方
- 基本的には, 引数等を何もつけずに実行すると, usage が出力される.
$ ./dclplot
[usage] : dclplot [options] [filename]
[options] :
--set-title="string"               draw the title.
--save-mode="string"               save file format
                                   "PS" => post script,
                                    depending on DCL versions
                                    (5.4->PS, 6.0.0->EPS, 6.0.2->PDF)
                                   "PNG" => png image.
--undef="string"                   set the undefined value.
--set-lidx=[idx numbers]           set each line index.
--set-ltyp=[typ numbers]           set each line type.
--set-pidx=[idx numbers]           set each marker index.
--set-ptyp=[typ numbers]           set each marker type.
--set-psiz=[siz values]            set each marker height.
--set-view{x,y}=[min:max]          set the {x,y} axis viewport.
                                   default = [0.2:0.8]
--set-{x,y}range=[min:max]         set the {x,y} axis range.
--with-{x,y}line=[colum numbers]   set the {x,y} coordinate value.
--with-{x,y}point=[colum numbers]  set the {x,y} coordinate value.
--set-{x,y}log                     set logalithm coordinate.
--with-clip                        clipping the value out of window.
--set-{x,y}title="string"          {x,y} axis title.
--set-{x,y}sub="string"            {x,y} axis unit.
--skip=int                         line number of reading skip.
--split="string"                   specifying splitting character.
                                   (default = splitting by space)
                                   ex. if you split by comma,
                                       --split=",".
                                   in case [tab], --split="tab".
--fact=float                       set uzfactor in DCL.
--{x,y}fact=float                  set {x,y}-axis factor.
--with-{x,y}grid="float1,.."       drawing grid lines for {x,y}-axis.
--set-exam="range"                 set example range (viewport)
                                   range = vxmin, vxmax, vymin, vymax.
------------------------------------------------------------
[example] : dclplot --with-xline=[1] --with-yline=[2:3:4] \
                    --set-title="hoge" test.dat
[NOTE] : --with-{x,y}line or --with-{x,y}point is neccesary.
[file format] : 1st array => values name (character)
                2nd array => values unit (character)
                3rd array and under => values
[CAUTION] : If "dclplot : No match." when you run this script,
            you may set "" in all options having square brackets
            ex. --with-xline="[1:2:3]".
読み込むテキストデータのフォーマット
- 最初の 2 行は文字で 1 行目にグラフの軸のタイトルを, 2 行目に単位を記述しておく.
- テキストカラムの分割は半角スペースやカンマ, タブ区切りなど, 任意の区切り文字に対応している.
- 欠損値処理も可能であり, 欠損値は文字でも構わない.
- 文字が欠損値のデータを描画する際は必ず, オプション (--undef) に指定しておかなければならない.
サンプル
サンプルとして置いている Jordan.dat は Jordan (1958) の高層気象観測データを csv 形式で記録したテキストデータである. このデータを元に主な動作を示す.
以下, "./dclplot" ではなく, "dclplot" で実行しているが, パスの通ったディレクトリに実行権限つきで格納していれば, 以下のコマンドで実行可能である.
1. そのまま実行 (ちなみに, カラム 3 は温度データ).
$ dclplot --with-xline=[1] --with-yline=[3] Jordan.dat
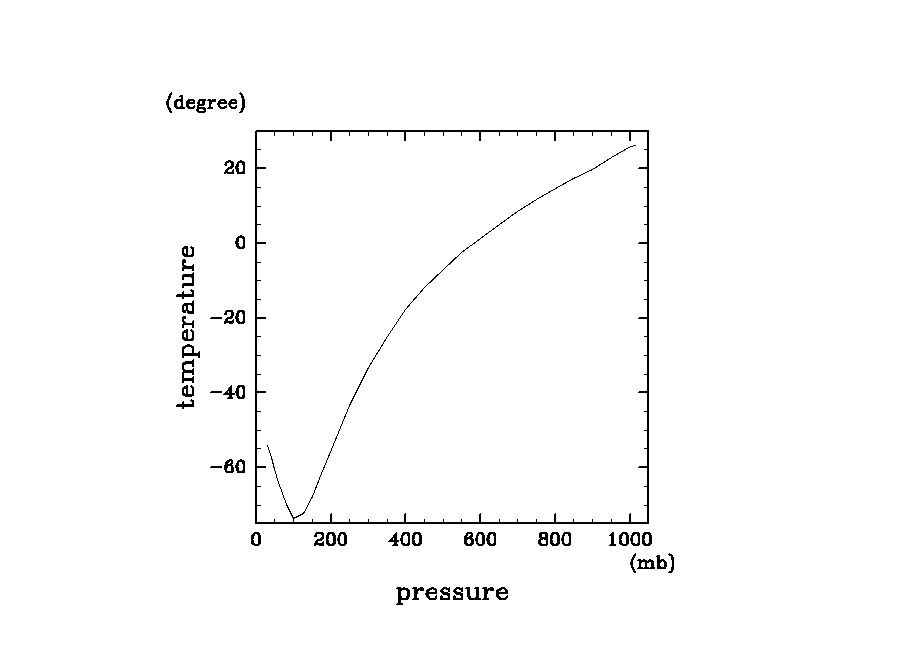
このままでは, 横軸に気圧データが来るので, 軸を入れ替える.
2. 軸の入れ替え
$ dclplot --with-xline=[3] --with-yline=[1] Jordan.dat
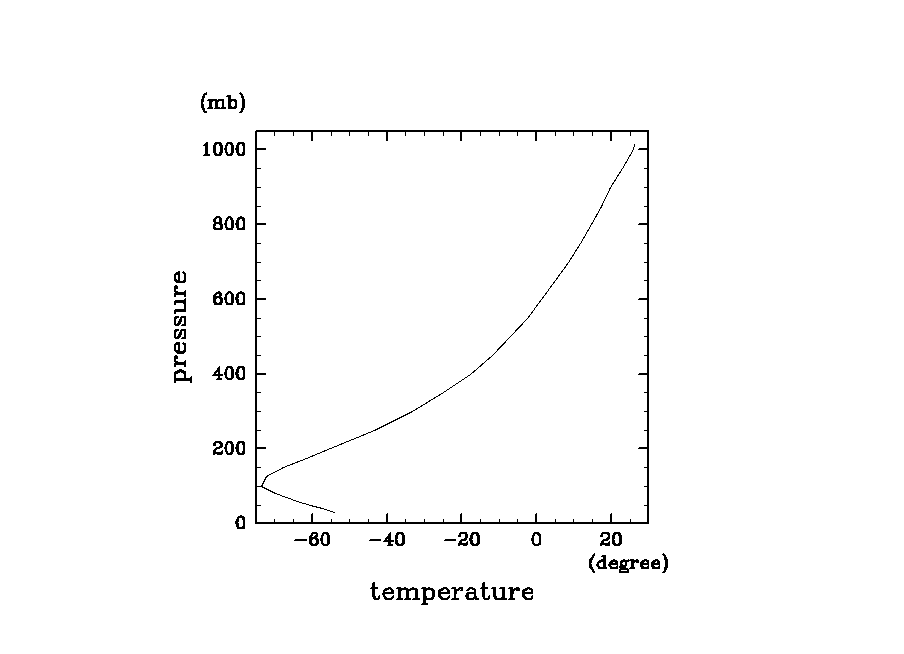
これでは直感的に鉛直座標が逆なので, range を指定して軸を逆転させる.
3. 範囲の指定 (--set-xrange, --set-yrange)
$ dclplot --with-xline=[3] --with-yline=[1] --set-xrange=[-80.0:30.0] \
  --set-yrange=[1020.0:10.0] Jordan.dat
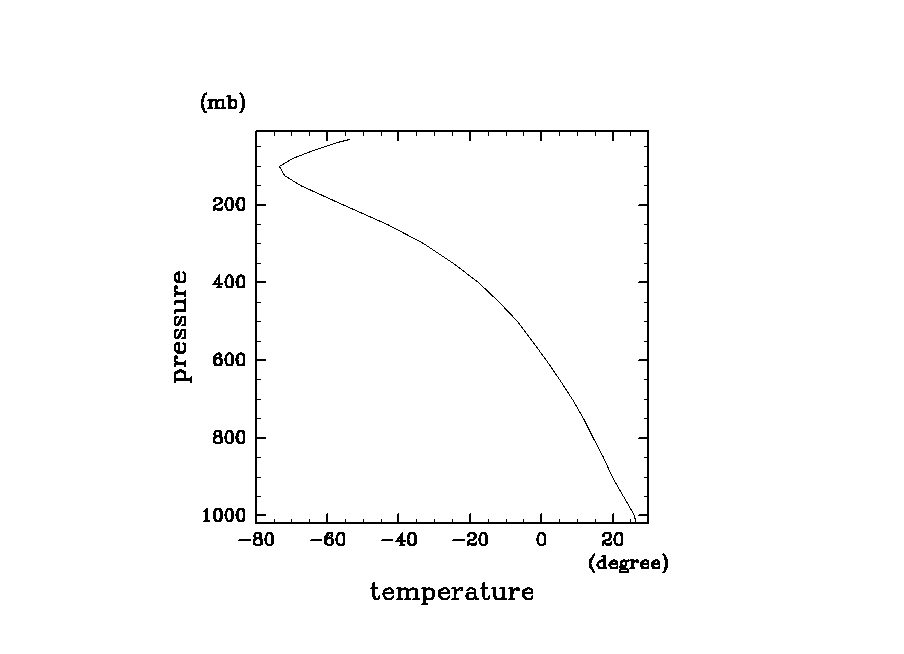
鉛直に気圧をとっているので, よく使われる log P 座標で見てみる.
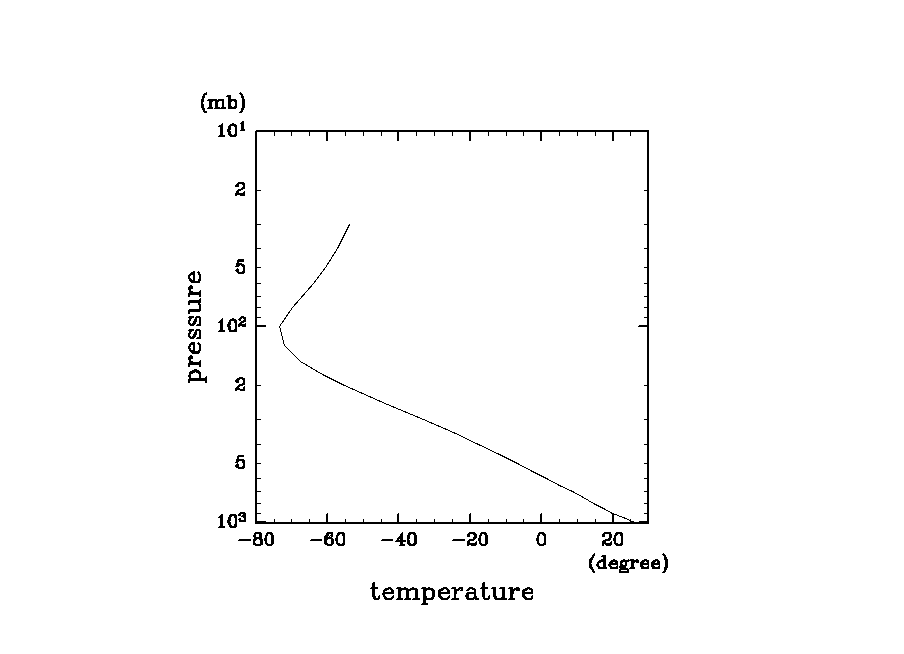
4. 対数座標の指定 (--set-xlog, --set-ylog)
$ dclplot --with-xline=[3] --with-yline=[1] --set-xrange=[-80.0:30.0] \
  --set-yrange=[1020.0:10.0] --set-ylog Jordan.dat
複数列のデータを重ねて表示させたい.
5. 複数データの表示(ここでは, 温位 5 番目と相当温位 6 番目で)
$ dclplot --with-xline=[5:6] --with-yline=[1] --set-xrange=[300.0:500.0] \
  --set-yrange=[1020.0:10.0] --set-ylog Jordan.dat
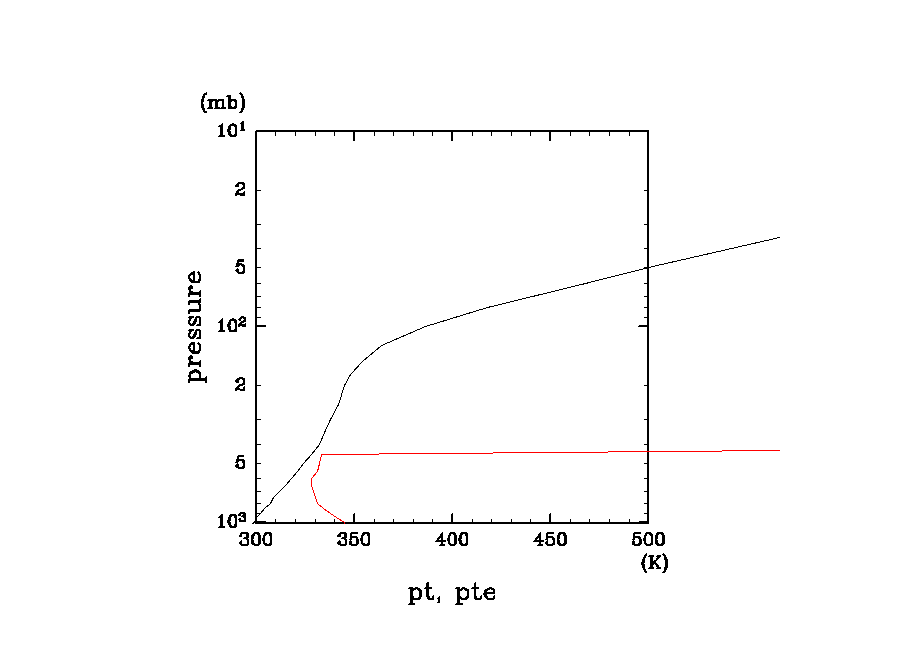
ここで, 黒線が温位, 赤線が相当温位データ. 湿度のデータが中層までしかないので, 赤線は途中から未定義値である 999.0 を指している.
未定義データを表示させないようにしたい.
6. 欠損値の非表示 (--undef)
$ dclplot --with-xline=[5:6] --with-yline=[1] --set-xrange=[300.0:500.0] \
  --set-yrange=[1020.0:10.0] --set-ylog --undef=999.0 Jordan.dat
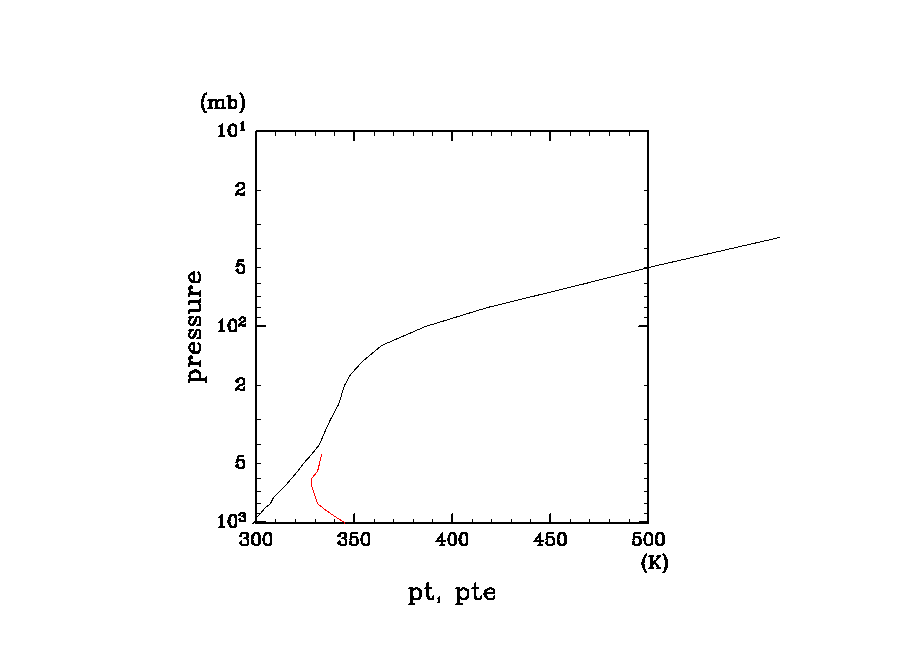
温位のデータが飛び出している.
7. クリッピング処理 (--with-clip)
$ dclplot --with-xline=[5:6] --with-yline=[1] --set-xrange=[300.0:500.0] \
  --set-yrange=[1020.0:10.0] --set-ylog --undef=999.0 --with-clip Jordan.dat
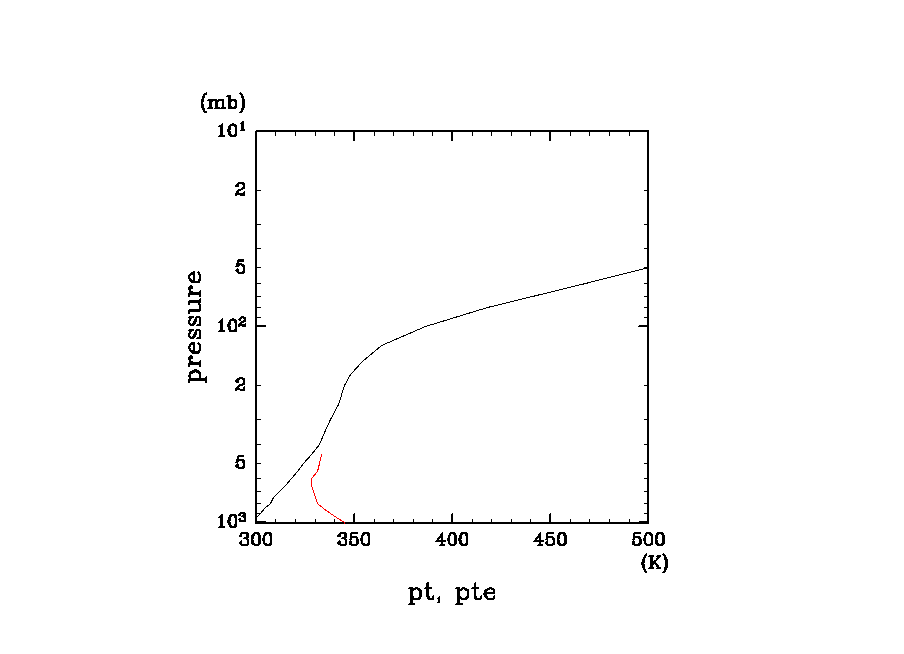
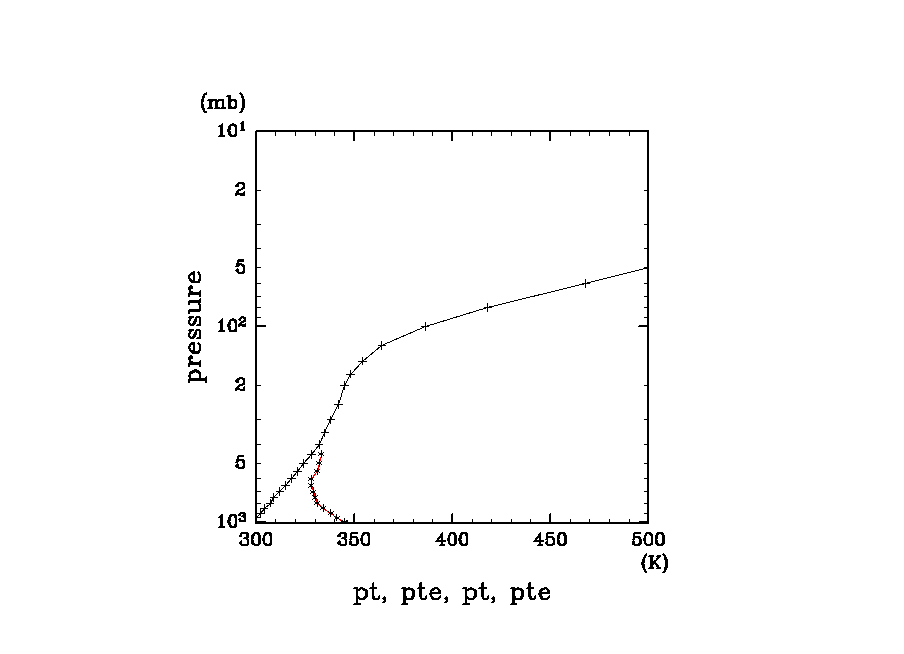
マーカーで重ねて表示したい.
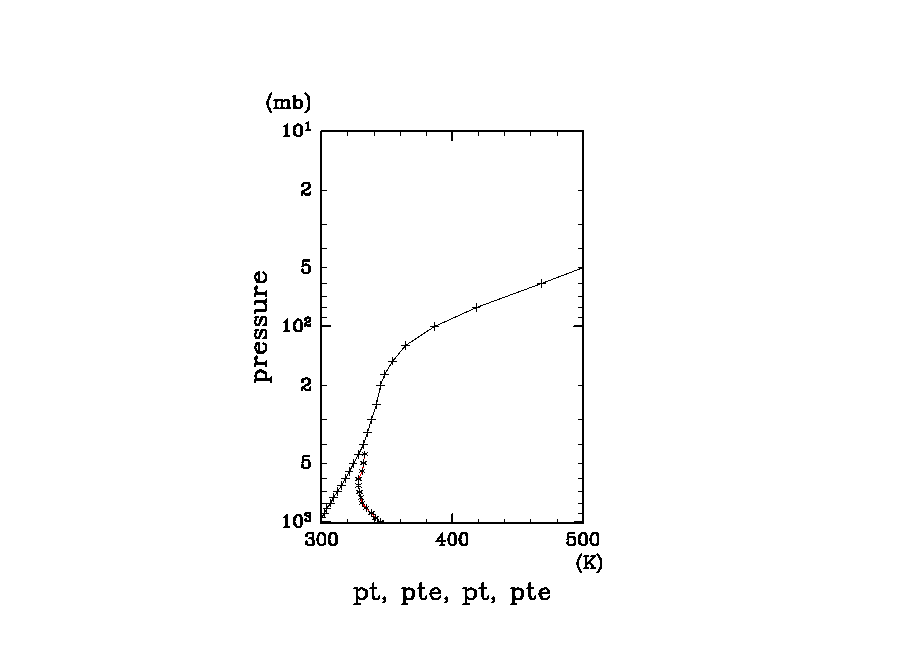
8. マーカー表示 (--with-xpoint, --with-ypoint)
$ dclplot --with-xline=[5:6] --with-yline=[1] --set-xrange=[300.0:500.0] \
  --set-yrange=[1020.0:10.0] --set-ylog --undef=999.0 --with-clip \
  --with-xpoint=[5:6] --with-ypoint=[1] Jordan.dat
スリムに見せたい
9. ビューポートの変更 (--set-viewx, --set-viewy)
$ dclplot --with-xline=[5:6] --with-yline=[1] --set-xrange=[300.0:500.0] \
  --set-yrange=[1020.0:10.0] --set-ylog --undef=999.0 --with-clip \
  --with-xpoint=[5:6] --with-ypoint=[1] --set-viewx=[0.3:0.7]  Jordan.dat
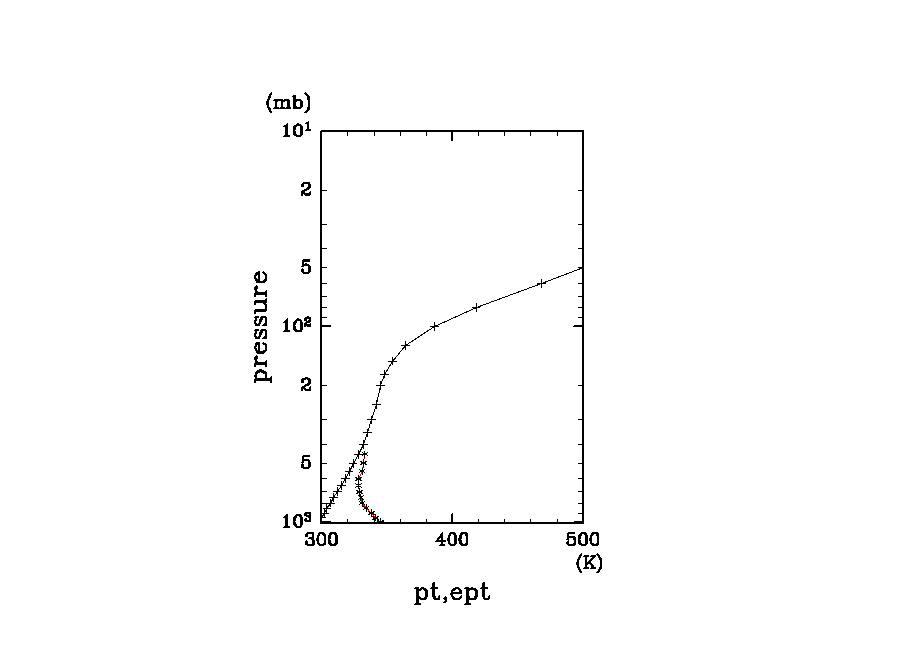
横軸タイトルがおかしい (このスクリプトはテキストデータの読み込まれた順にタイトルを追加していく仕様).
10. 軸タイトルの変更 (--set-xtitle, --set-ytitle)
$ dclplot --with-xline=[5:6] --with-yline=[1] --set-xrange=[300.0:500.0] \
  --set-yrange=[1020.0:10.0] --set-ylog --undef=999.0 --with-clip \
  --with-xpoint=[5:6] --with-ypoint=[1] --set-viewx=[0.3:0.7] \
  --set-xtitle="pt,ept" Jordan.dat
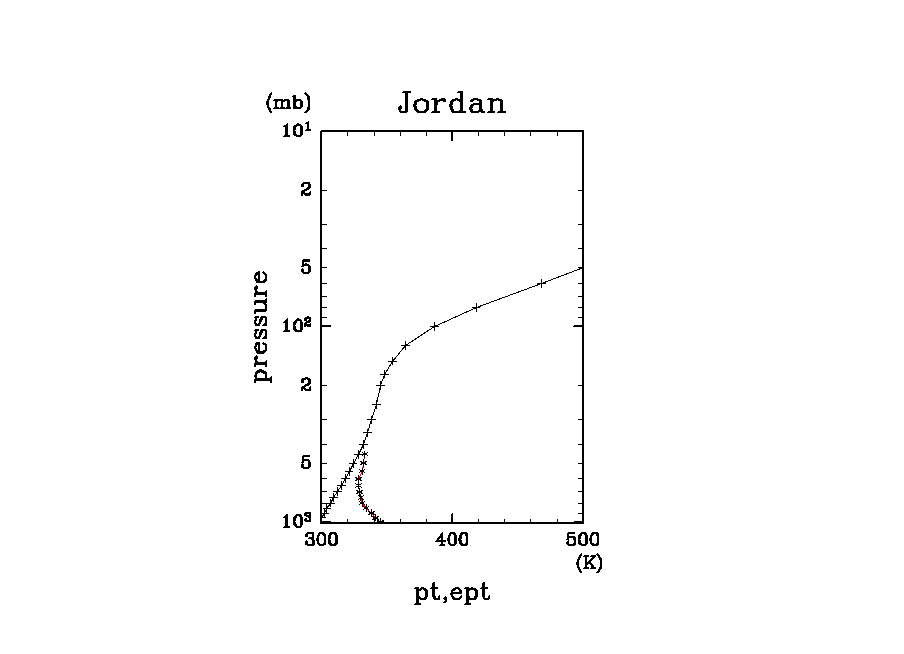
グラフのタイトルをつけたい.
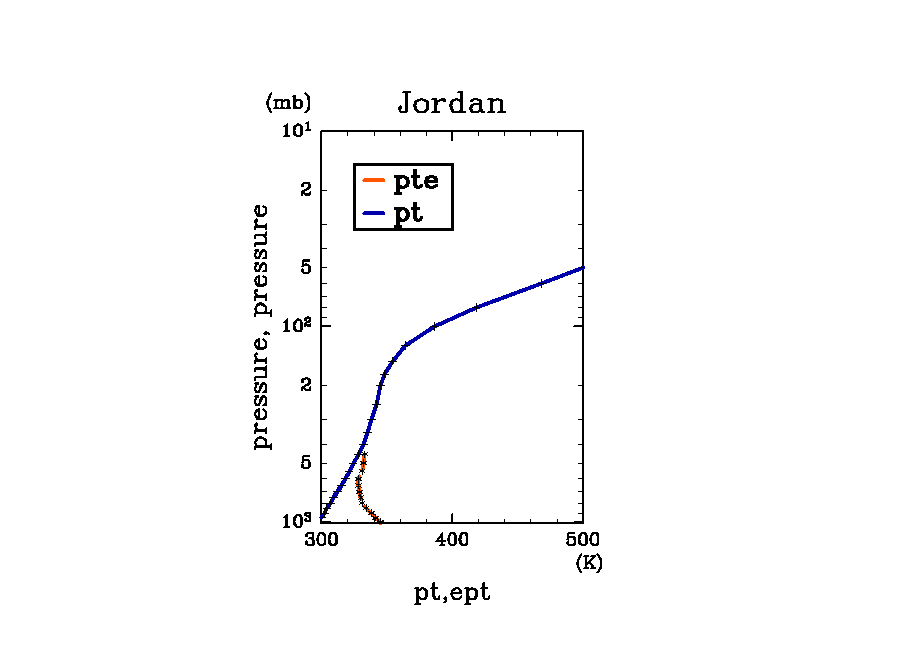
11. タイトルの作成 (--set-title)
$ dclplot --with-xline=[5:6] --with-yline=[1] --set-xrange=[300.0:500.0] \
  --set-yrange=[1020.0:10.0] --set-ylog --undef=999.0 --with-clip \
  --with-xpoint=[5:6] --with-ypoint=[1] --set-viewx=[0.3:0.7] \
  --set-xtitle="pt,ept" --set-title='Jordan' Jordan.dat
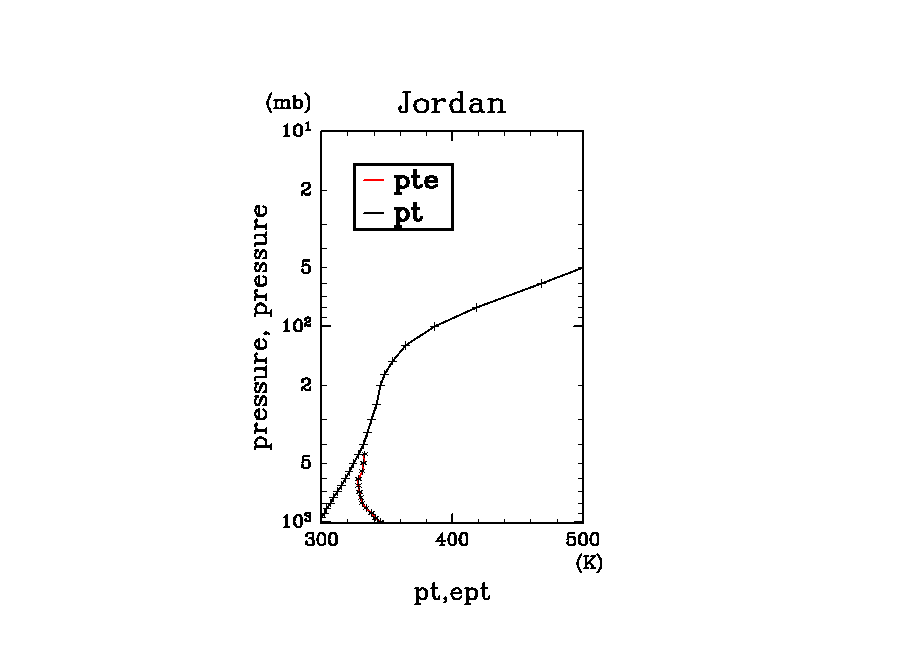
12. 凡例をつけたい (--set-exam)
$ dclplot --with-xline=[5:6] --with-yline=[1] --set-xrange=[300.0:500.0] \
  --set-yrange=[1020.0:10.0] --set-ylog --undef=999.0 --with-clip \
  --with-xpoint=[5:6] --with-ypoint=[1] --set-viewx=[0.3:0.7] \
  --set-xtitle="pt,ept" --set-title='Jordan' --set-exam="0.35,0.5,0.65,0.75" \
  Jordan.dat
指定する数値は dcl の V 座標系で指定する.
ただし, この凡例は現在 --with-{x,y}line が指定されたときのみ対応.
13. 線種を変えたい (--set-{lidx,ltyp,pidx,ptyp,psiz})
$ dclplot --with-xline=[5:6] --with-yline=[1] --set-xrange=[300.0:500.0] \
  --set-yrange=[1020.0:10.0] --set-ylog --undef=999.0 --with-clip \
  --with-xpoint=[5:6] --with-ypoint=[1] --set-viewx=[0.3:0.7] \
  --set-xtitle="pt,ept" --set-title='Jordan' --set-exam="0.3,0.5,0.6,0.8" \
  --set-lidx=[206:806] --set-ltyp=[1:2] Jordan.dat
このとき, 各数値の値は dcl の index, type, size にそれぞれ一致する.
14. 軸の factor 倍 (--{x,y}fact)
$ dclplot --with-xline=[5:6] --with-yline=[1] --set-xrange=[300.0:500.0] \
  --set-yrange=[102000.0:1000.0] --set-ylog --undef=999.0 --with-clip \
  --with-xpoint=[5:6] --with-ypoint=[1] --set-viewx=[0.3:0.7] \
  --set-xtitle="pt,ept" --set-title='Jordan' --set-exam="0.3,0.5,0.6,0.8" \
  --set-lidx=[206:806] --set-ltyp=[1:2] --yfact=0.01 \
  --set-ysub="Pa" Jordan.dat
ここで, 指定される factor はデータを 1/factor することに注意.
たとえば, Pa 単位のデータを hPa で表示させるためには, factor = 100.0 と指定しなければならない. second 単位のデータを hour で表示させるためには, factor = 3600.0 と指定する. 上の例は hPa -> Pa に変換しているので, factor = 0.01 となる. こっそり y 軸の単位も変更 (--set-ysub).
[注意] : この操作を行うと, --set-{x,y}range も変更しなければならない. 具体例は上を参考のこと (--set-{x,y}range).

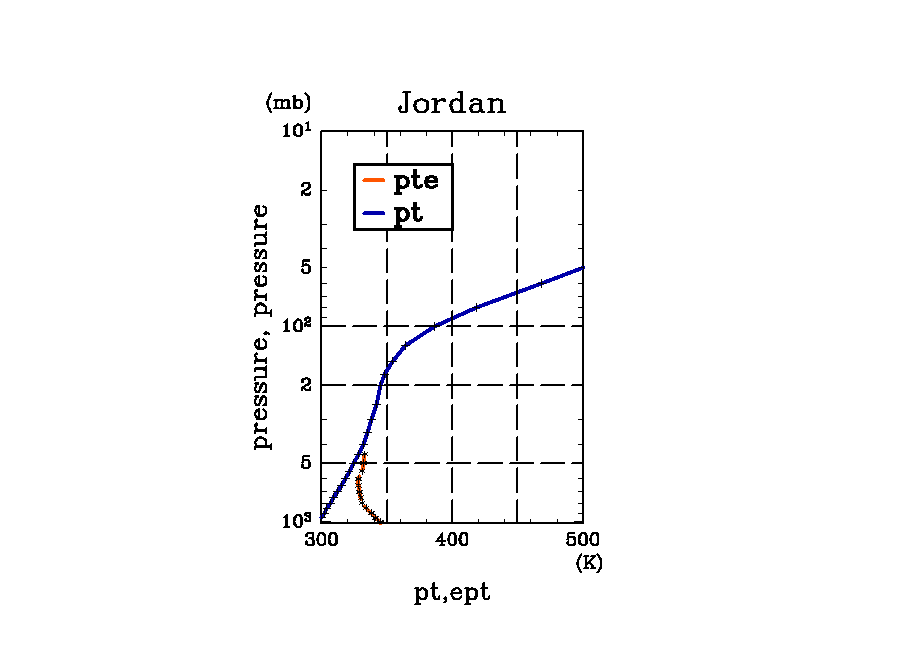
15. 軸の基準線 (--with-{x,y}grid)
$ dclplot --with-xline=[5:6] --with-yline=[1] --set-xrange=[300.0:500.0] \
  --set-yrange=[102000.0:1000.0] --set-ylog --undef=999.0 --with-clip \
  --with-xpoint=[5:6] --with-ypoint=[1] --set-viewx=[0.3:0.7] \
  --set-xtitle="pt,ept" --set-title='Jordan' --set-exam="0.3,0.5,0.6,0.8" \
  --set-lidx=[206:806] --set-ltyp=[1:2] \
  --with-xgrid="300.0,400.0,500.0" --with-ygrid="500.0,200.0,100.0" \
  Jordan.dat
現在, 軸の線種は index = 3, type = 2 で固定.
16. Post Script への出力 (--save-mode)
$ dclplot --with-xline=[5:6] --with-yline=[1] --set-xrange=[300.0:500.0] \
  --set-yrange=[1020.0:10.0] --set-ylog --undef=999.0 --with-clip \
  --with-xpoint=[5:6] --with-ypoint=[1] --set-viewx=[0.3:0.7] \
  --save-mode=PS Jordan.dat
17. ファイルの先頭 a[任意の int] 行読み飛ばし (--skip)
$ dclplot --with-xline=[5:6] --with-yline=[1] --set-xrange=[300.0:500.0] \
  --set-yrange=[1020.0:10.0] --set-ylog --undef=999.0 --with-clip \
  --with-xpoint=[5:6] --with-ypoint=[1] --set-viewx=[0.3:0.7] \
  --skip=int Jordan.dat
キーワード:
参照: