(Tips) GAnalysis::Histogram の使い方
ヒストグラム
使用方法
1次元ヒストグラム
NumRu::GAnalysis.histogram1D(gphys[, options])
NumRu::GAnalysis.histogram(gphys[, options])
gphys.histogram([options])
gphys.histogram([options])
- gphys: (GPhys)
- options: (Hash)
- nbins: (Integer) ビン数
- min, max: (Numeric) 最小値および最大値
2次元ヒストグラム
NumRu::GAnalysis.histogram2D(gphys0, gphys1[, options])
- gphys0, gphys1: (GPhys)
- options: (Hash)
- nbins0: (Integer) gphys0 に対するビン数
- nbins1: (Integer) gphys1 に対するビン数
- min0, max0: (Numeric) gphys0 に対する最小値および最大値
- min1, max1: (Numeric) gphys1 に対する最小値および最大値
1次元ヒストグラムプロット
NumRu::GGraph.histogram(gphys[, options])
- gphys: (GPhys)
- options: (Hash)
- window: (Array of 4 Numerics) ウィンドウの範囲 [xmin, xmax, ymin, ymax]
- title: (String) 図のタイトル
使用例
ソースファイルに付属のサンプルを実行した結果の図
ソース
require "numru/gphys"
require "numru/ggraph"
module NumRu
module GAnalysis
begin
require "gsl"
HistogramGSL = true
rescue LoadError
HistogramGSL = false
end
module_function
def histogram(gphys0,opts=Hash.new)
unless HistogramGSL
raise "gsl is necessary to use this method"
end
unless GPhys === gphys0
raise "gphys0 (1st arg) must be GPhys"
end
unless Hash === opts
raise "opts (2nd arg) must be Hash"
end
nbins = opts["nbins"] || gphys0.total/500
nbins = 10 if nbins < 1
min = opts["min"] || gphys0.min.val
max = opts["max"] || gphys0.max.val
hist = GSL::Histogram.alloc(nbins,[min,max])
val = gphys0.val
val = val.get_array![val.get_mask!] if NArrayMiss === val
hist.increment(val)
bounds = hist.range.to_na
center = (bounds[0..-2]+bounds[1..-1])/2
name = gphys0.name
attr = gphys0.data.attr_copy
bounds = VArray.new(bounds, attr, name)
center = VArray.new(center, attr, name)
axis = Axis.new(true)
axis.set_cell(center, bounds, name)
axis.set_pos_to_center
bin = hist.bin.to_na
bin = VArray.new(bin,
{"long_name"=>"number in bins", "units"=>"1"},
"bin")
new_gphys = GPhys.new(Grid.new(axis), bin)
new_gphys.set_att("mean",[hist.mean])
new_gphys.set_att("standard_deviation",[hist.sigma])
return new_gphys
end
alias :histogram1D :histogram
def histogram2D(gphys0, gphys1, opts=Hash.new)
unless HistogramGSL
raise "gsl is necessary to use this method"
end
unless GPhys === gphys0
raise "gphys0 (1st arg) must be GPhys"
end
unless GPhys === gphys1
raise "gphys1 (2nd arg) must be GPhys"
end
unless Hash === opts
raise "opts (3nd arg) must be Hash"
end
nbins0 = opts["nbins0"] || gphys0.total/500
nbins0 = 10 if nbins0 < 1
nbins1 = opts["nbins1"] || gphys1.total/500
nbins1 = 10 if nbins1 < 1
min0 = opts["min0"] || gphys0.min.val
max0 = opts["max0"] || gphys0.max.val
min1 = opts["min1"] || gphys1.min.val
max1 = opts["max1"] || gphys1.max.val
hist = GSL::Histogram2d.alloc(nbins0,[min0,max0],nbins1,[min1,max1])
val0 = gphys0.val
val1 = gphys1.val
mask = nil
if NArrayMiss === val0
mask = val0.get_mask!
val0 = val0.get_array!
end
if NArrayMiss === val1
if mask
mask = mask & val1.get_mask!
else
mask = val1.get_mask!
end
val1 = val1.get_array!
end
if mask
val0 = val0[mask]
val1 = val1[mask]
end
hist.increment(val0.to_gslv, val1.to_gslv)
bounds0 = hist.xrange.to_na
center0 = (bounds0[0..-2]+bounds0[1..-1])/2
name = gphys0.name
attr = gphys0.data.attr_copy
bounds0 = VArray.new(bounds0, attr, name)
center0 = VArray.new(center0, attr, name)
axis0 = Axis.new(true)
axis0.set_cell(center0, bounds0, name)
axis0.set_pos_to_center
bounds1 = hist.yrange.to_na
center1 = (bounds1[0..-2]+bounds1[1..-1])/2
name = gphys1.name
attr = gphys1.data.attr_copy
bounds1 = VArray.new(bounds1, attr, name)
center1 = VArray.new(center1, attr, name)
axis1 = Axis.new(true)
axis1.set_cell(center1, bounds1, name)
axis1.set_pos_to_center
bin = hist.bin.to_na.reshape!(nbins1,nbins0).transpose(1,0)
bin = VArray.new(bin,
{"long_name"=>"number in bins", "units"=>"1"},
"bin")
new_gphys = GPhys.new(Grid.new(axis0,axis1), bin)
new_gphys.set_att("mean0",[hist.xmean])
new_gphys.set_att("standard_deviation0",[hist.xsigma])
new_gphys.set_att("mean1",[hist.ymean])
new_gphys.set_att("standard_deviation1",[hist.ysigma])
new_gphys.set_att("covariance",[hist.cov])
return new_gphys
end
end
class GPhys
def histogram(opts=Hash.new)
GAnalysis.histogram(self, opts)
end
alias :histogram1D :histogram
end
module GGraph
module_function
@@histogram_options = Misc::KeywordOptAutoHelp.new(
['window', [nil,nil,0,nil], "window bounds"],
['title', "histogram", "window title"]
)
def histogram(gphys, newframe=true, options=nil)
gropn_1_if_not_yet
if newframe!=true && newframe!=false
raise ArgumentError, "2nd arg (newframe) must be true of false"
end
unless gphys.rank == 1
raise ArgumentError, "rank of gphys must be 1"
end
unless gphys.axis(0).cell?
raise ArgumentError, "axis must be cell type"
end
opts = @@histogram_options.interpret(options)
x = gphys.axis(0).cell_bounds
y = gphys
if newframe
fig(x, y, "window"=>opts["window"])
axes(x, y, "title"=>opts["title"])
end
DCL::uvbxf(x.val, [0]*y.length, y.val)
return nil
end
alias :histogram1D :histogram
end
end
if $0 == __FILE__
include NumRu
npoints = 10000
rng = GSL::Rng.alloc
vary = VArray.new(rng.weibull(1,2,npoints).to_na,
{"long_name"=>"wind speed", "units"=>"m/s"},
"u")
axis = Axis.new
axis.pos = VArray.new(NArray.sint(npoints),
{"long_name"=>"points"},
"points")
gphys1D = GPhys.new(Grid.new(axis), vary)
npoints = 100000
na0 = rng.weibull(1,2,npoints).to_na
na1 = rng.gaussian(0.5,npoints).to_na
theta = Math::PI/6
vary0 = VArray.new(na0*Math.cos(theta)-na1*Math.sin(theta),
{"long_name"=>"zonal wind speed", "units"=>"m/s"},
"u")
vary1 = VArray.new(na0*Math.sin(theta)+na1*Math.cos(theta),
{"long_name"=>"meridional wind speed", "units"=>"m/s"},
"v")
axis = Axis.new
axis.pos = VArray.new(NArray.sint(npoints),
{"long_name"=>"points"},
"points")
gphys2D_0 = GPhys.new(Grid.new(axis), vary0)
gphys2D_1 = GPhys.new(Grid.new(axis), vary1)
DCL::gropn(4)
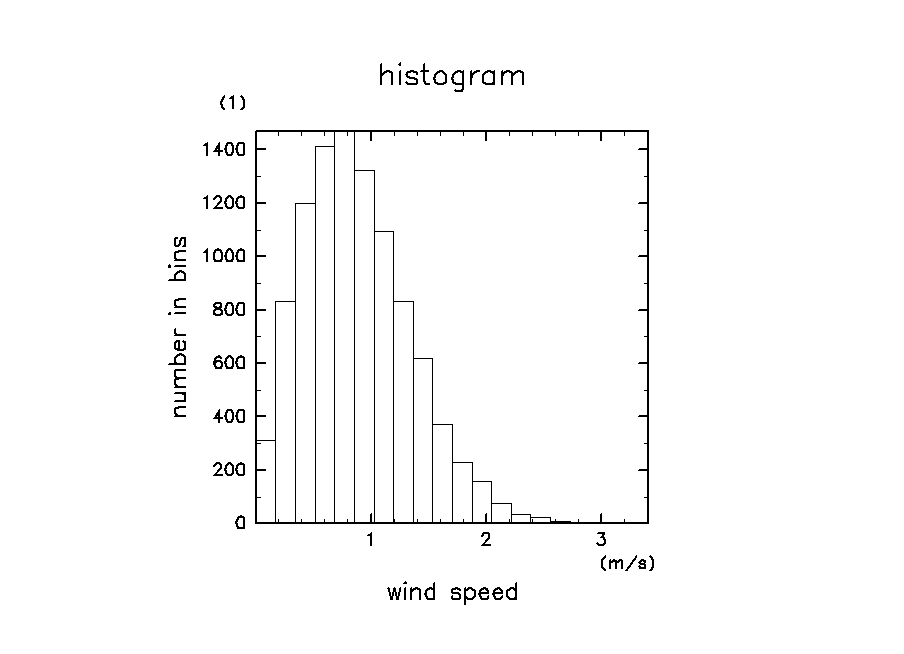
hist = GAnalysis.histogram(gphys1D)
GGraph.histogram(hist)
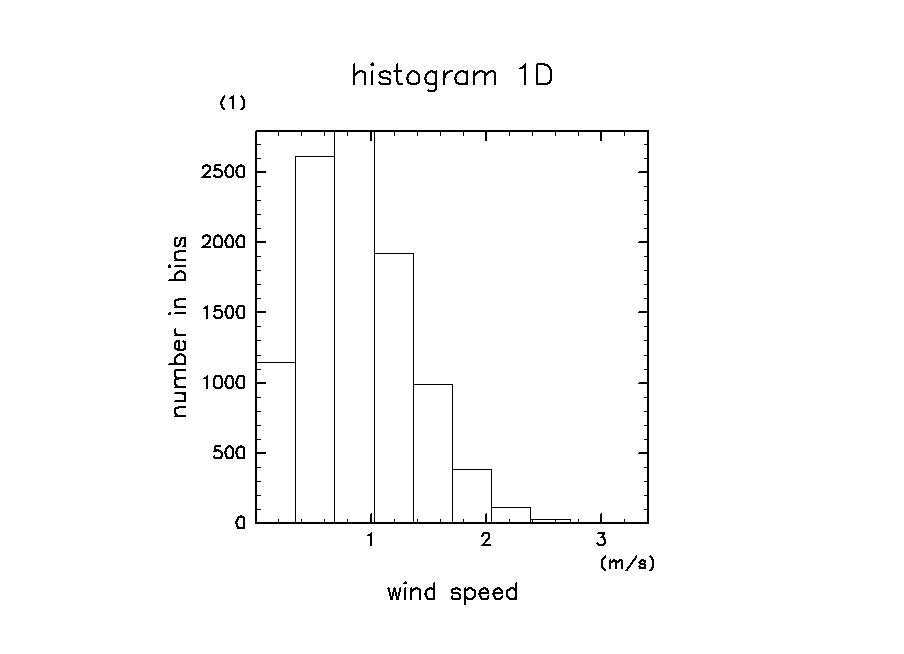
hist = gphys1D.histogram("nbins"=>10)
GGraph.histogram(hist, true, "title"=>"histogram 1D")
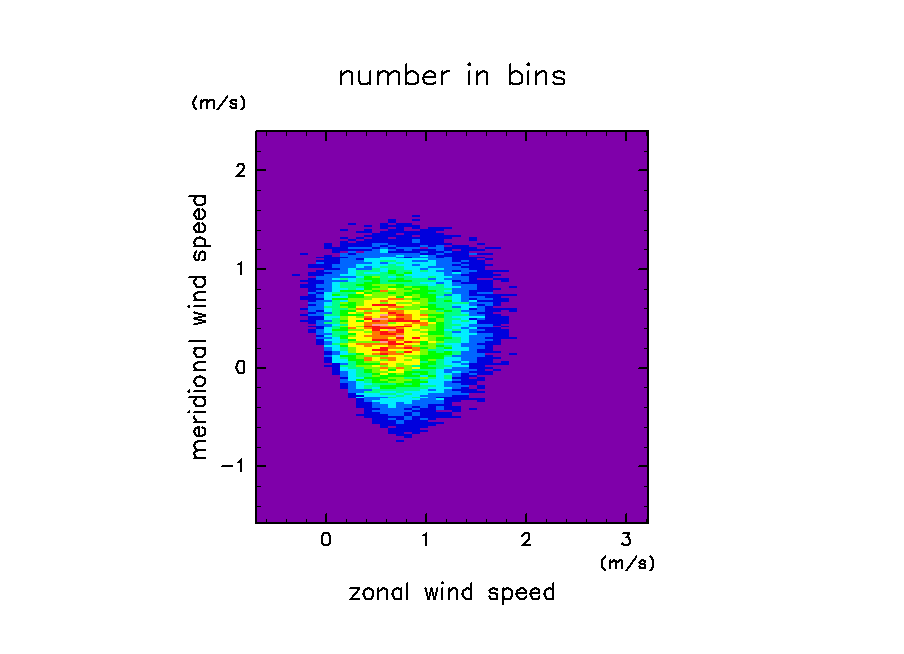
hist = GAnalysis.histogram2D(gphys2D_0, gphys2D_1, "nbins0"=>50)
GGraph.tone(hist, true, "tonc"=>true)
DCL::grcls
end
キーワード:
参照: