(Application) 2 次元描画スクリプト dcl2dplot
作成者:辻野智紀
概要
gnuplot のように, テキストカラムデータを上から読み込んで, 2 次元の等値線, カラーシェードグラフとして描画する ruby スクリプトである.
dclplot を 2 次元版にしたものです.
依存ライブラリ
- GPhys
- GGraph
使い方
- 基本的には, 引数等を何もつけずに実行すると, usage が出力される.
$ ./dcl2dplot
[usage] : dcl2dplot [options] [filename]
[options] :
--title="string" : draw the title.
--save-mode="string" : save file format
                       "string" : "PS" => post script, "PNG" => png
                                  default = "PNG"
--undef="string" : set the undefined value.
--set-xrange=[min:max] : set the x axis range.
--set-yrange=[min:max] : set the y axis range.
--set-axises=[colum number(x):colum number(y)] :
             set the x coordinate value.
             ex. --set-axises=[1:2].
--contour=[colum number] : set the contour value.
                               ex. --contour=[3].
--shade=[colum number] : set the color shade value.
                               ex. --shade=[4].
--set-cphys=[string:string] : set the contour [value name:unit].
                               ex. --set-cunit=[Temperature:K].
--set-sphys=[string:string] : set the shade [value name:unit].
                               ex. --set-sunit=[heat flux:W m-2].
--set-xtitle="string" : x axis title.
--set-ytitle="string" : y axis title.
--set-xsub="string" : x axis unit.
--set-ysub="string" : y axis unit.
--skip=number : line skip number.
--split=type : split type.
               ex. if you split by comma, --split=",".
               except : if you split by [tab], --split="tab".
[example] : dcl2dplot --set-axises=[1:2] --contour=[3] test.dat
[NOTE] : --contour or --shade, and --set-axises is neccesary.
読み込むテキストデータのフォーマット
- x, y 軸の格子座標データと等値線あるいはカラーシェードで描く物理量をカラム形式で記述しておく.
- 軸の格子座標データは不等間隔でも対応するが, 座標値は小さい値から大きい値となるように記述する.
- おおまかな座標値の記述方法はサンプルデータファイル参照.
- サンプルデータは x 軸を固定して y 軸の値を入れているが, 逆でも構わない.
- テキストカラムの分割は半角スペースやカンマ, タブ区切りなど, 任意の区切り文字に対応している.
- 欠損値処理も可能であり, 欠損値は文字でも構わない.
- 文字が欠損値のデータを描画する際は必ず, オプション (--undef) に指定しておかなければならない.
サンプル
サンプルとして置いている gauss.dat は 2 次元ガウシアン分布を csv 形式で記録したテキストデータである. このデータを元に主な動作を示す.
以下, "./dcl2dplot" ではなく, "dcl2dplot" で実行しているが, パスの通ったディレクトリに実行権限つきで格納していれば, 以下のコマンドで実行可能である.
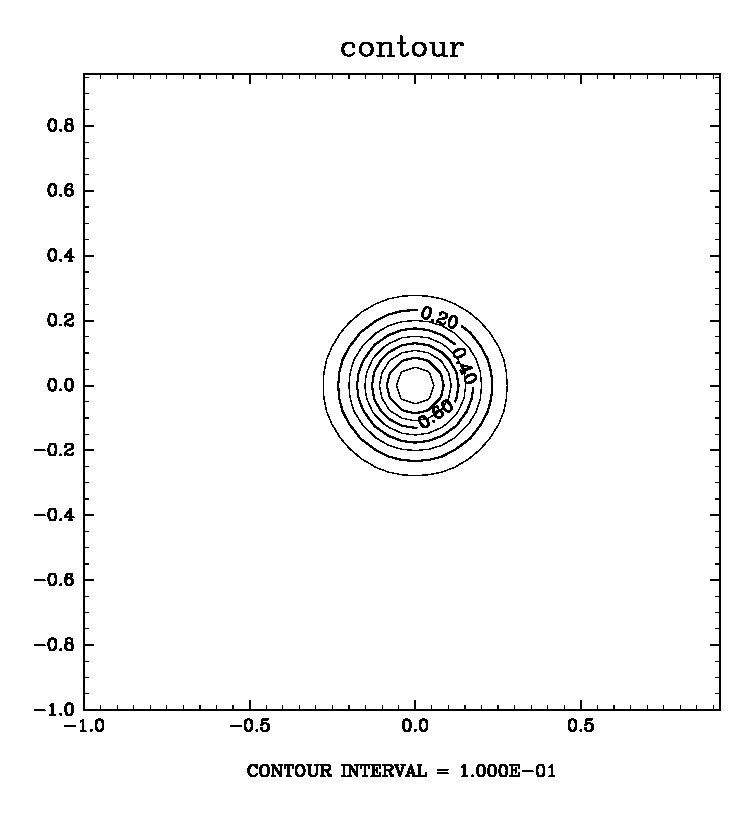
1. そのまま実行.
$ dcl2dplot --set-axises=[1:2] --contour=[3] gauss.dat
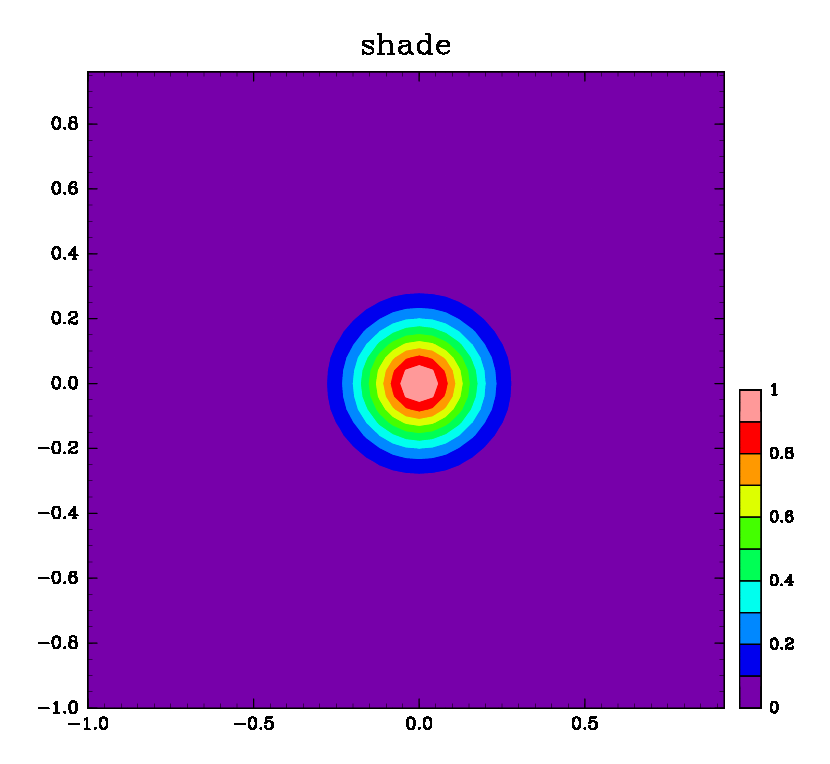
2. カラーシェードにしてみる.
$ dcl2dplot --set-axises=[1:2] --shade=[3] gauss.dat
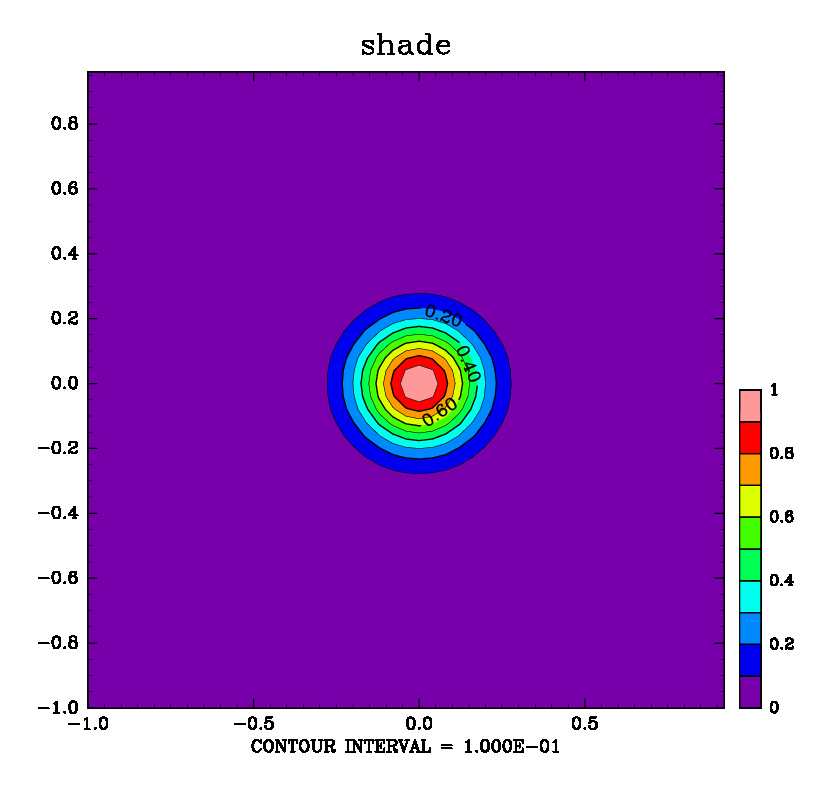
3. 両方書いてみる.
$ dcl2dplot --set-axises=[1:2] --contour=[3] --shade=[3] gauss.dat
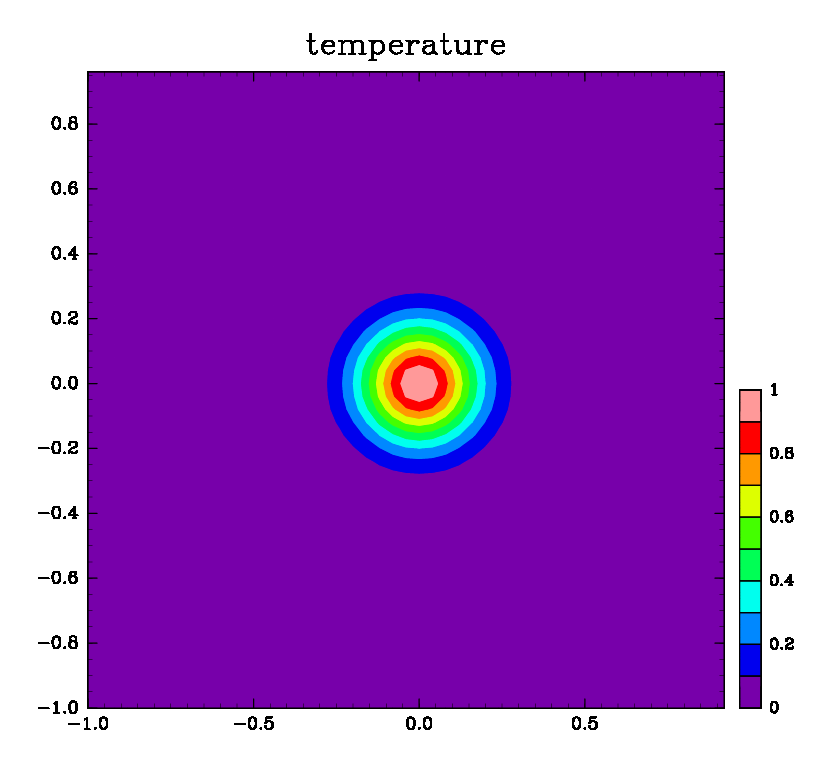
4. gphys のデータを入れてみる.
$ dcl2dplot --set-axises=[1:2] --shade=[3] --set-sphys=[temperature:K] gauss.dat
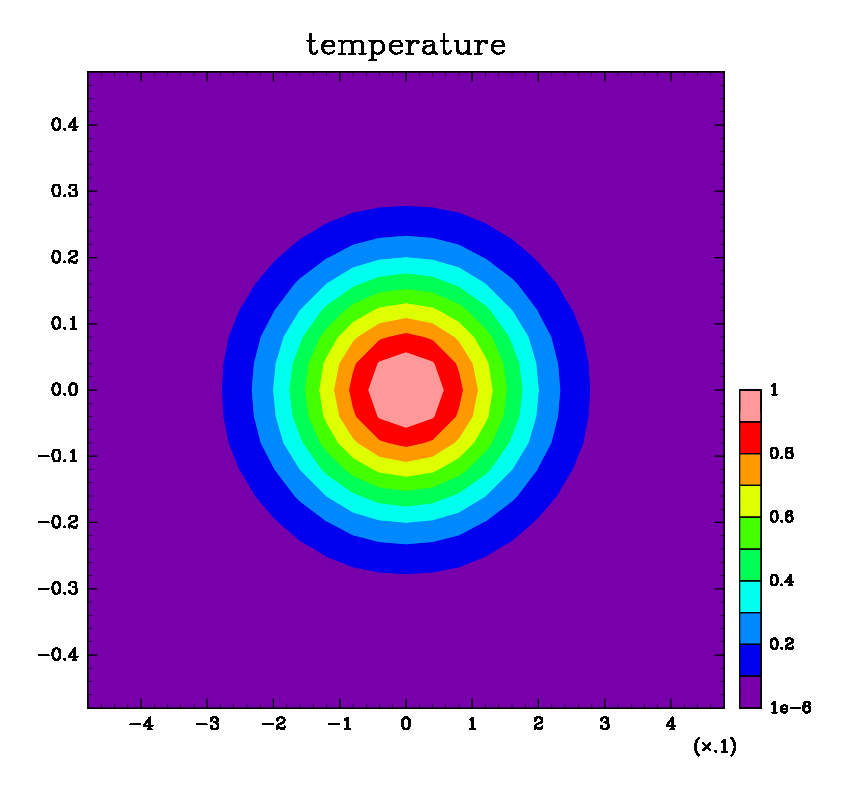
5. 領域を指定してみる.
$ dcl2dplot --set-axises=[1:2] --shade=[3] --set-sphys=[temperature:K] \
--set-xrange=[-0.5:0.5] --set-yrange=[-0.5:0.5] gauss.dat
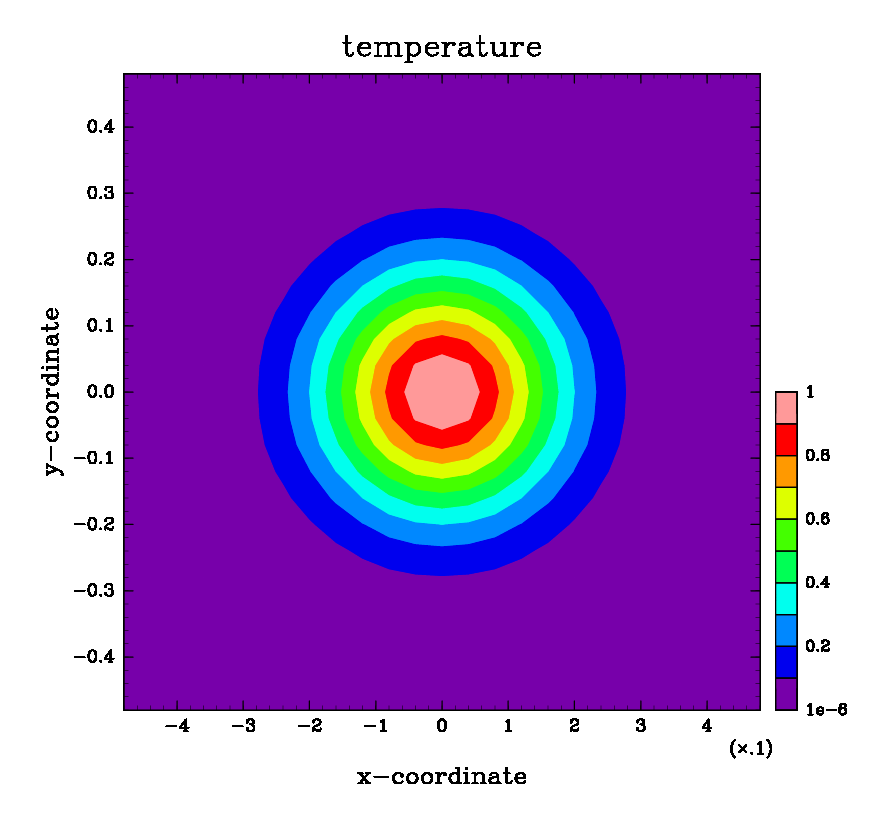
6. 軸のタイトルを書く.
$ dcl2dplot --set-axises=[1:2] --shade=[3] --set-sphys=[temperature:K] \
--set-xrange=[-0.5:0.5] --set-yrange=[-0.5:0.5] \
--set-xtitle="x-coordinate" --set-ytitle="y-coordinate" gauss.dat
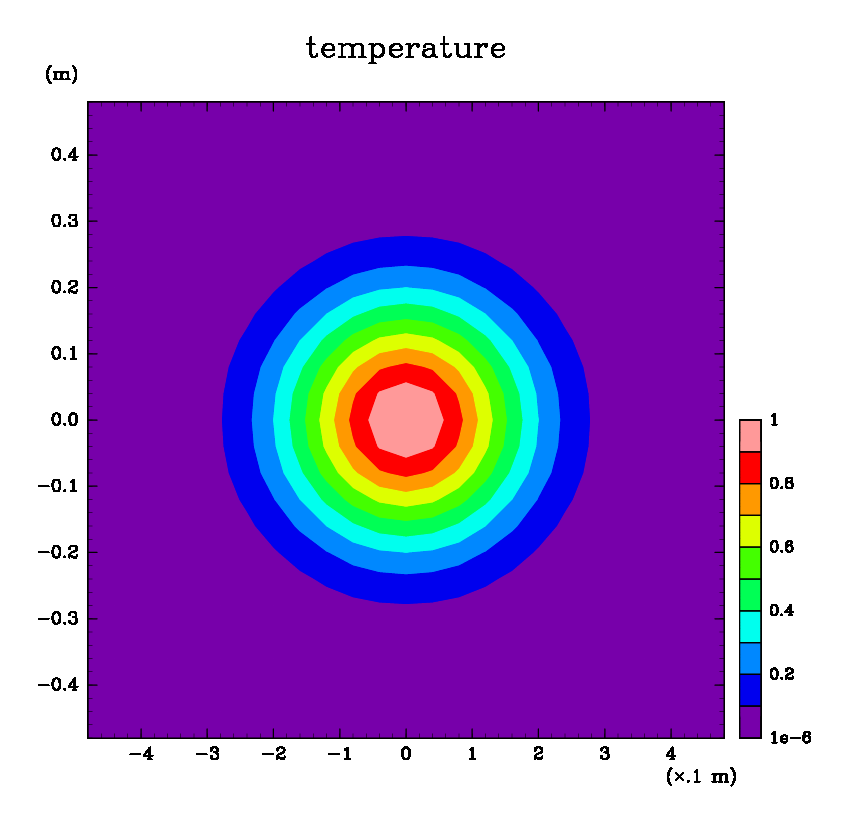
7. 軸に単位をつける (--set-xsub, --set-ysub)
$ dcl2dplot --set-axises=[1:2] --shade=[3] --set-sphys=[temperature:K] \
--set-xrange=[-0.5:0.5] --set-yrange=[-0.5:0.5] \
--set-xtitle="x-coordinate" --set-ytitle="y-coordinate" \
--set-xsub="m" --set-ysub="m" gauss.dat
8. Post Script への出力 (--save-mode)
$ dcl2dplot --set-axises=[1:2] --shade=[3] --set-sphys=[temperature:K] \
--set-xrange=[-0.5:0.5] --set-yrange=[-0.5:0.5] \
--set-xtitle="x-coordinate" --set-ytitle="y-coordinate" \
--set-xsub="m" --set-ysub="m" --save-mode="PS" gauss.dat
キーワード:
参照: